2 Day Workshop for IATF 16949 Standard and 5 core tools in Ohio
Serving Ohio, Indiana, Pennsylvania, Kentucky, and Illinois
IATF16949 Core Tools Overview
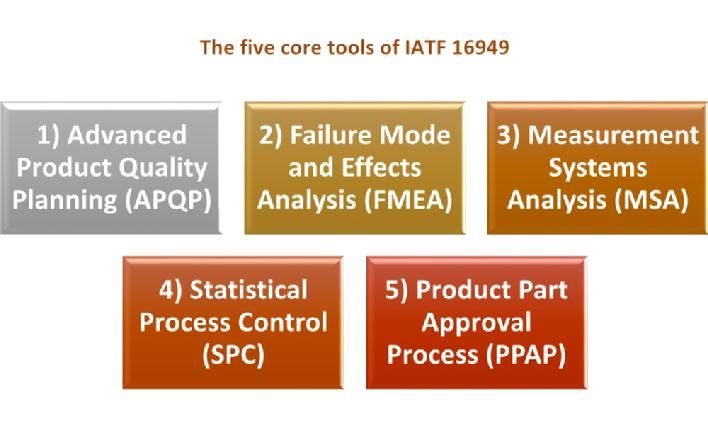
This is a 2-day workshop of the IATF16949 standard and the 5 core tools. It will enable you to understand the basic requirements of the IATF 16949 Quality Management System Requirements, and the 5 Core Tools.
- Advanced Product Quality Planning (APQP)
- Failure Mode and Effects Analysis (FMEA)
- Production Part Approval Process (PPAP)
- Fundamental Statistical Process Control (SPC)
- Measurement System Analysis (MSA)
This workshop has been specifically designed to provide an overview of the Core Tools for those personnel who do not use the tools as a part of their normal job, but need an understanding of what these Core Tools cover (e.g. internal auditors, managers, support staff)
Workshop Content
| IATF 16949 Requirements | 2 hours |
|---|---|
| APQP | 3 hours |
| FMEA | 3 hours |
| PPAP | 3 hours |
| SPC | 2 hours |
| MSA | 2 hours |
You need to attend this workshop if:
You are an internal quality auditor and need to have a working knowledge of the core tools. You will find out what to look for in an audit. Attending this course will allow internal auditors to meet GM & Ford's Customer Specific Requirements for an internal auditor to have training in the core tools.
You are directly or indirectly supporting personnel who use the Core Tools on a daily basis and you need to understand what they are doing so you can assist them.
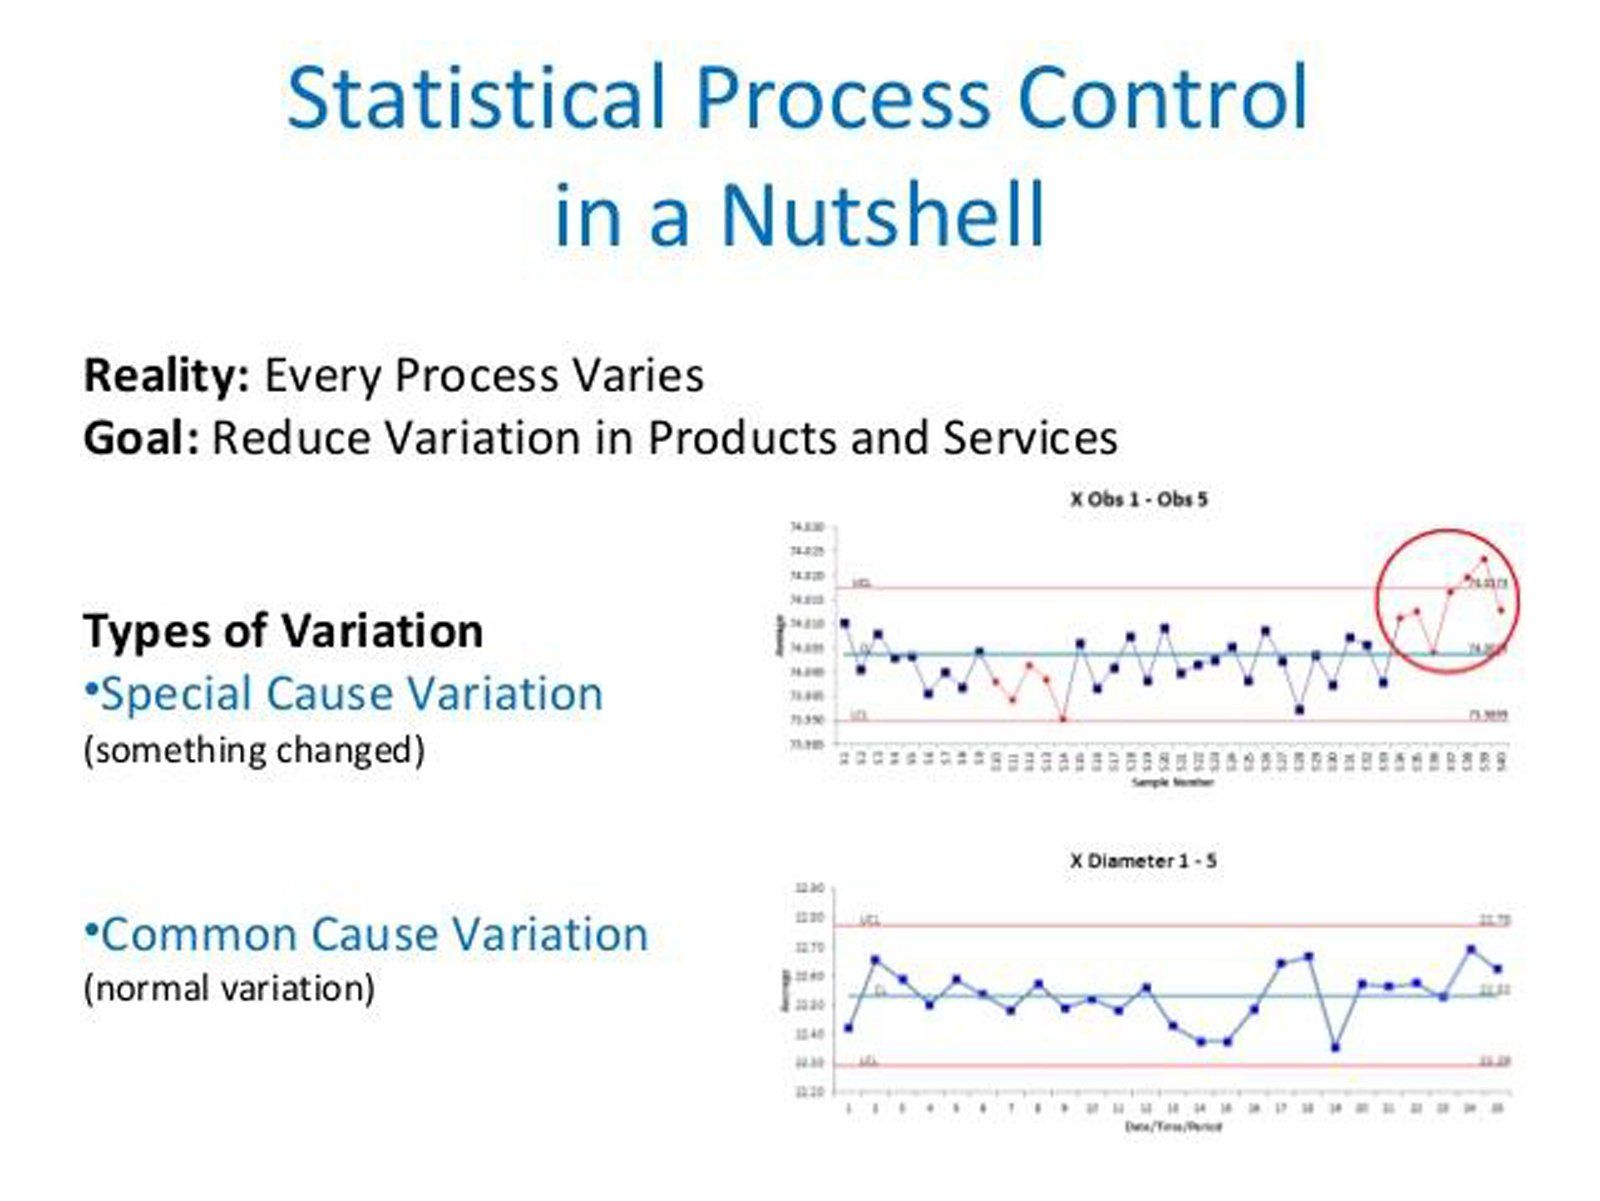
Statistical process control (SPC) procedures can help you monitor process behavior. Arguably the most successful SPC tool is the control chart, originally developed by Walter Shewhart in the early 1920s. A control chart helps you record data and lets you see when an unusual event, e.g., a very high or low observation compared with “typical” process performance, occurs. Control charts attempt to distinguish between two types of process variation:
- Common cause variation, which is intrinsic to the process and will always be present.
- Special cause variation, which stems from external sources and indicates that the process is out of statistical control.
Various tests can help determine when an out-of-control event has occurred. However, as more tests are employed, the probability of a false alarm also increases.
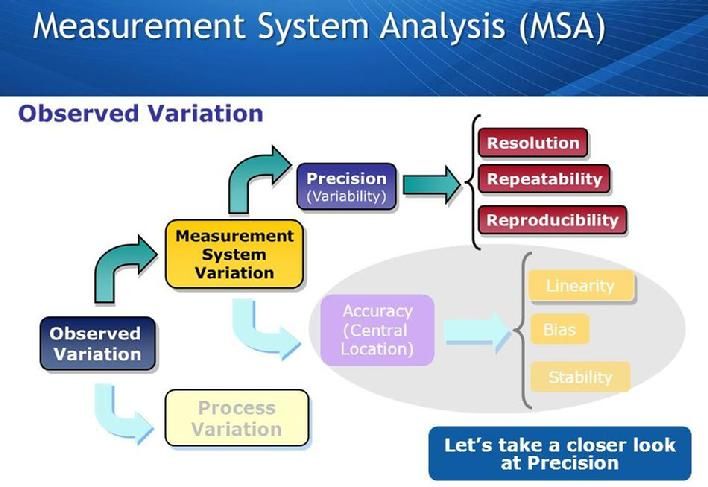
Measurement System Analysis (MSA) and Gage Management are important in controlling variation in measurement systems. Measurement systems are used every day in manufacturing, research and development and sales and marketing. Attributes which are measured include distances, temperatures, strengths, resistances, and sales, just to name a few.
Often measurements are made with little regard for the quality of such measurements. Yet all too often, the measurements are not representative of the true value of the characteristic being measured. That might be because the measurement system is not accurate enough, not precise enough, introduces bias into the measurement, or is not properly being used by the operator.
The moral to the previous paragraph is that before you embark on using a new measurement system for a characteristic which has not been previously measured on it, you should perform a measurement capability analysis. Measurement capability analyses are critical to the success of every measurement and ensure that future measurements will be representative of the characteristic being measured.
MSA includes detailed tutorials on many measurement system analysis techniques including how to conduct and analyze GR&R (Gage Repeatability and Reproducibility) Studies.
A GR&R is the accepted techniques for evaluating the level of variation in a measurement system and determining if the measurement system is acceptable for use.
Measurement System Analysis covers techniques for analyzing the variation within a measurement system, determining its suitability for use, and ways to improve measurement systems. The GR&R analysis techniques used in MSA are in compliance with IATF 16949 standard.
Once a measurement system is found to be acceptable, it is equally important to institute a formal system to manage the measurement system to ensure that it continues to be reliable and dependable. MSA explores approaches to managing measurement systems to ensure that they can be depended upon.
Gage R&R
Gage Repeatability and Reproducibility (Gage R & R) is a methodology used to define the amount of variation in the measurement data due to the measurement system. It then compares measurement variation to the total variability observed, consequently defining the capability of the measurement system. Measurement variation consists of two important factors, repeatability, and reproducibility. Repeatability is due to equipment variation and reproducibility is due to inspector or operator variation. Gage R & R can make known:
- The amount of measurement system variation compared with the process variation
- The amount of variation in the measurement system that is due to operator influence
- The measurement system’s capability to discriminate between different parts
Why Perform Gage Repeatability & Reproducibility (Gage R&R)
Within any quality system there is variance in measurement data. Within all manufacturing processes, there is variation. All measurement data has some degree of variance or errors. A robust SPC process requires accurate and precise data to have the greatest impact on product quality. Being quality professionals, we need to determine what percentage of variance is due to the measurement system. Gage Repeatability and Reproducibility is a proven method for evaluating the capability of a measurement system. A Gage R & R study examines repeatability of the equipment and reproducibility of the appraiser. Understanding Gage R & R allows us to predict the percentage or probability of measurement error and understand the source of the variation (equipment or appraiser). Through determination of where the variation in the measurement system exists, we can take appropriate action and improve the quality of our data. Better data leads to better decisions, fewer errors, and higher quality.

FMEA Failure Mode and Effects Analysis
What You Should Know About Failure Mode and Effects Analysis (FMEA)
All products or processes have failure modes. The effects are the impacts when the failures occur. A FMEA is a tool to:
- Identify the relative risks designed into a product or process
- Develop and take action to reduce the risks with the highest potential impact
- Track the results of the action to determine risk reduction or elimination
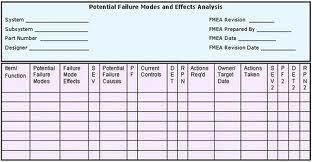
Failure Mode and Effects Analysis helps you focus on and understand the impact of potential failures of process or product. A ranking methodology is used to prioritize the risks relative to each other. An RPN or Risk Priority Number is calculated for each failure mode and its resulting effect(s). The RPN is a function of three factors: The Severity of the effect, the frequency of Occurrence of the cause of the failure, and the ability to detect (or prevent) the failure or effect before it escapes to the customer.
RPN = Severity rating X Occurrence rating X Detection rating (S x O x D = RPN)
The RPN can range from a low of 1 to a high of 1,000
Once the RPNs are determined, you need to develop a Corrective/Preventive Action Plan to reduce the risks of failure modes of high RPNs.
Next, use the completed FMEA as the basis for developing a Control Plan and work instructions. Control Plans are a summary of defect prevention and reactive detection techniques and must mirror the FMEA.
The Purpose of an FMEA
FMEAs help us focus on and understand the impact of potential process or product failures
A disciplined analysis is used to rank the risks relative to each other.
A Risk Priority Number, or RPN, is calculated for each failure mode and its resulting effect(s).
The RPN is a function of three factors: The Severity of the effect, the frequency of Occurrence of the cause of the failure, and the ability to Detect the failure or effect.
The RPN = The Severity ranking X the Occurrence ranking X the Detection ranking.
The RPN can range from a low of 1 to a high of 1,000.
Develop a Corrective or Preventive Action Plan to reduce risks with unacceptable high RPNs.
Use FMEAs as the basis for Control Plans. Control Plans are a summary of proactive defect prevention and reactive detection techniques. Control Plans must mirror the FMEA.
APQP - Advanced Product Quality Planning
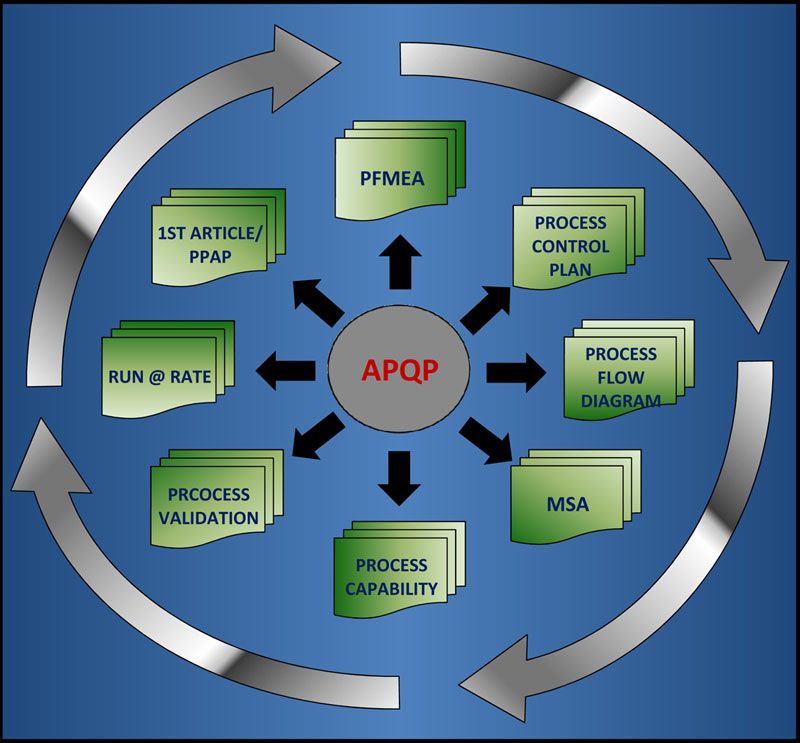
Advanced Product Quality Planning (or APQP) is a framework of procedures and techniques used to develop products in industry, particularly the automotive industry. It is quite similar to the concept of Design for Six Sigma (DFSS).
It is a defined process for a product development system for General Motors, Ford, Chrysler, and their suppliers. According to the Automotive Industry Action Group (AIAG), the purpose of APQP is "to produce a product quality plan which will support development of a product or service that will satisfy the customer." The process is described in the AIAG manual.
Main content of APQP
APQP serves as a guide in the development process and also a standard way to share results between suppliers and automotive companies. APQP specify three phases: Development, Industrialization and Product Launch. Through these phases 23 main topics will be monitored. These 23 topics will be all completed before the production is started. They cover aspects as: design robustness, design testing and specification compliance, production process design, quality inspection standards, process capability, production capacity, product packaging, product testing and operators training plan between other items.
APQP focuses on:
- Up-front quality planning
- Determining if customers are satisfied by evaluating the output and supporting continual improvement
- APQP consists of five phases:
- Plan and Define Program
- Product Design and Development Verification
- Process Design and Development Verification
- Product and Process Validation
- Launch, Feedback, Assessment & Corrective Action
There are five major activities:
- Planning
- Product Design and Development
- Process Design and Development
- Product and Process Validation
- Production
The APQP process has seven major elements:
- Understanding the needs of the customer
- Proactive feedback and corrective action
- Designing within the process capabilities
- Analyzing and mitigating failure modes
- Verification and validation
- Design reviews
- Control special / critical characteristics
Our 2-day course can jumpstart your organization’s competitive edge and compatibility. Call us at 330-327-3060.
CONTACT INFORMATION
Phone:
(330) 327-3060
Email:
info@nckconsulting.com
Address: North Canton, Ohio
BUSINESS HOURS
Monday - Friday 8:30 am to 5:00 pm
Saturday - Sunday Closed


